

Statistics
Use the Statistics Page to:
- See daily usage charts.
- Predict the burn down rate of funds on your account.
- View a list of events created on-chain and their smart contract addresses.
Tracking Your Usage
View daily usage charts to track your account balance over time.
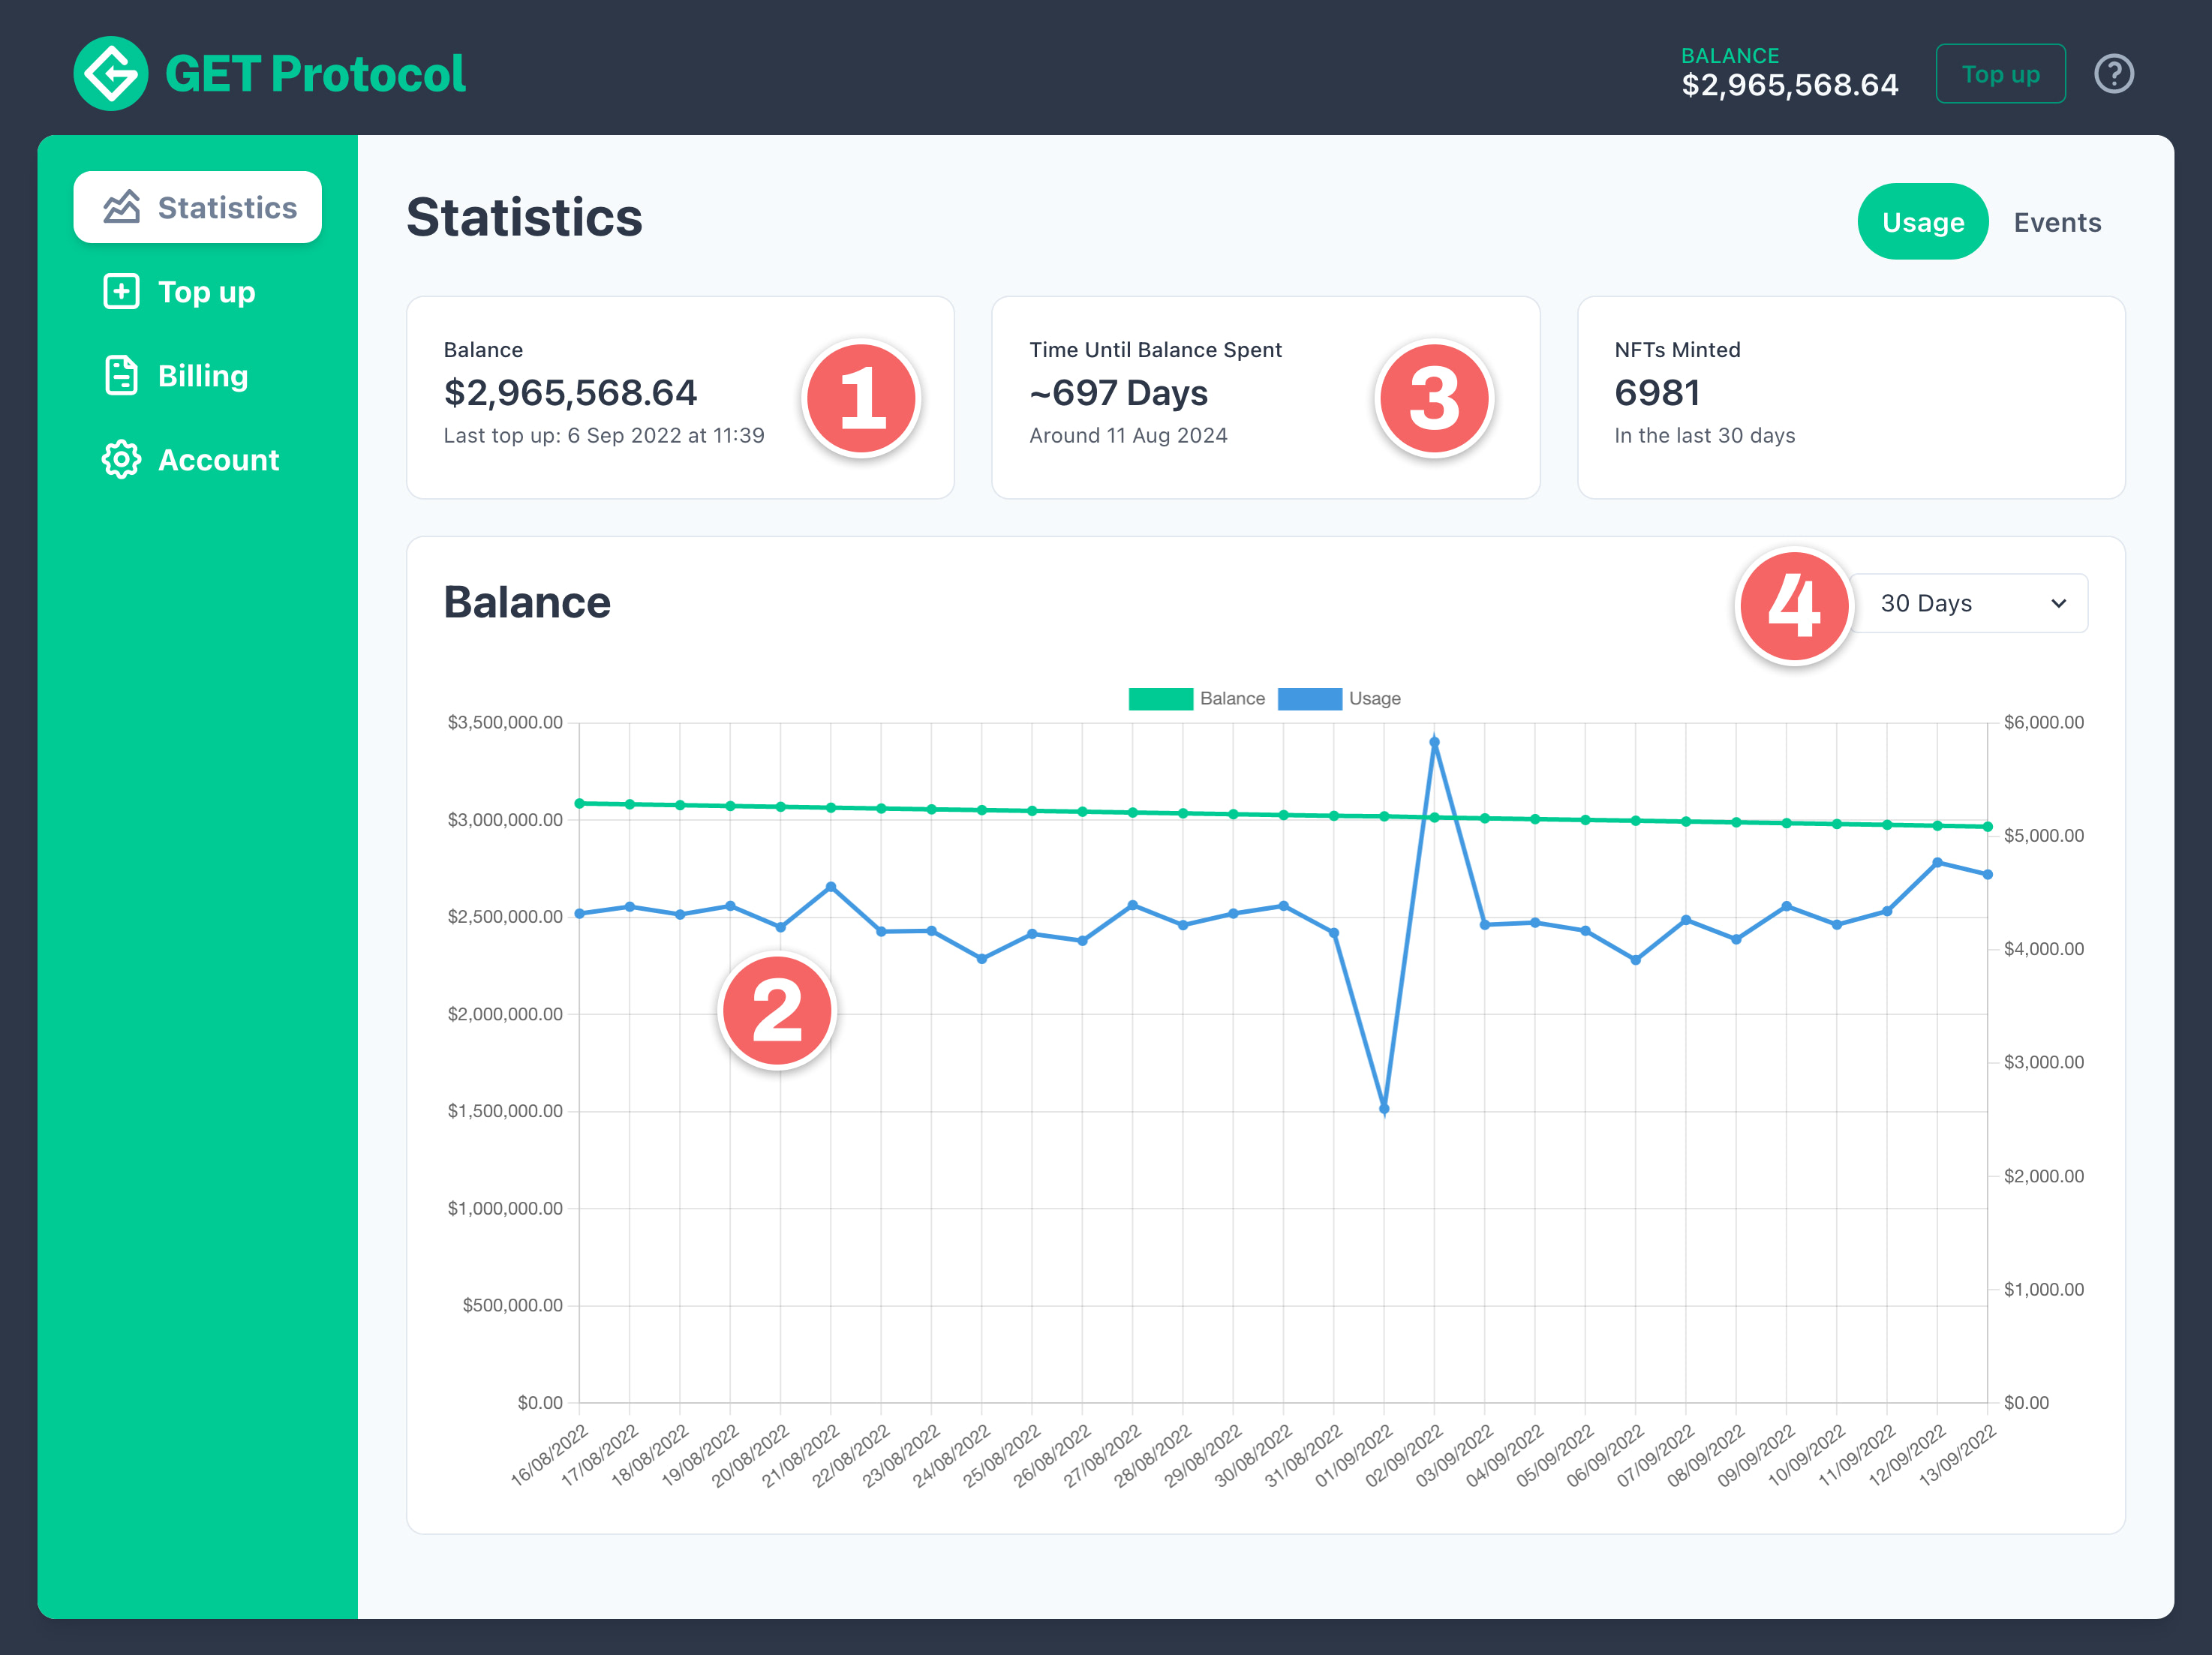
1. Available Balance
Your available balance on account in USD, to be used for funding further service usage.
2. Usage Charts
On the chart you will see two plots; one for the remaining balance over time (green) and another for daily usage (blue). The remaining balance will trend downwards until top-up. Hover your mouse over the chart for exact usage data.
3. Estimated Days on Balance
The number of days of usage you have remaining on your balance. While we attempt to always give an accurate prediction, this can't ever be 100% perfect and account for usage spikes so this should be used as a guide on approximately the time remaining to top-up rather than an exact date.
4. Setting the Window
The time window of the chart can be set at 7 days, 30 days, or 90 days of usage using the dropdown to the top right of the chart view.
Listing Events
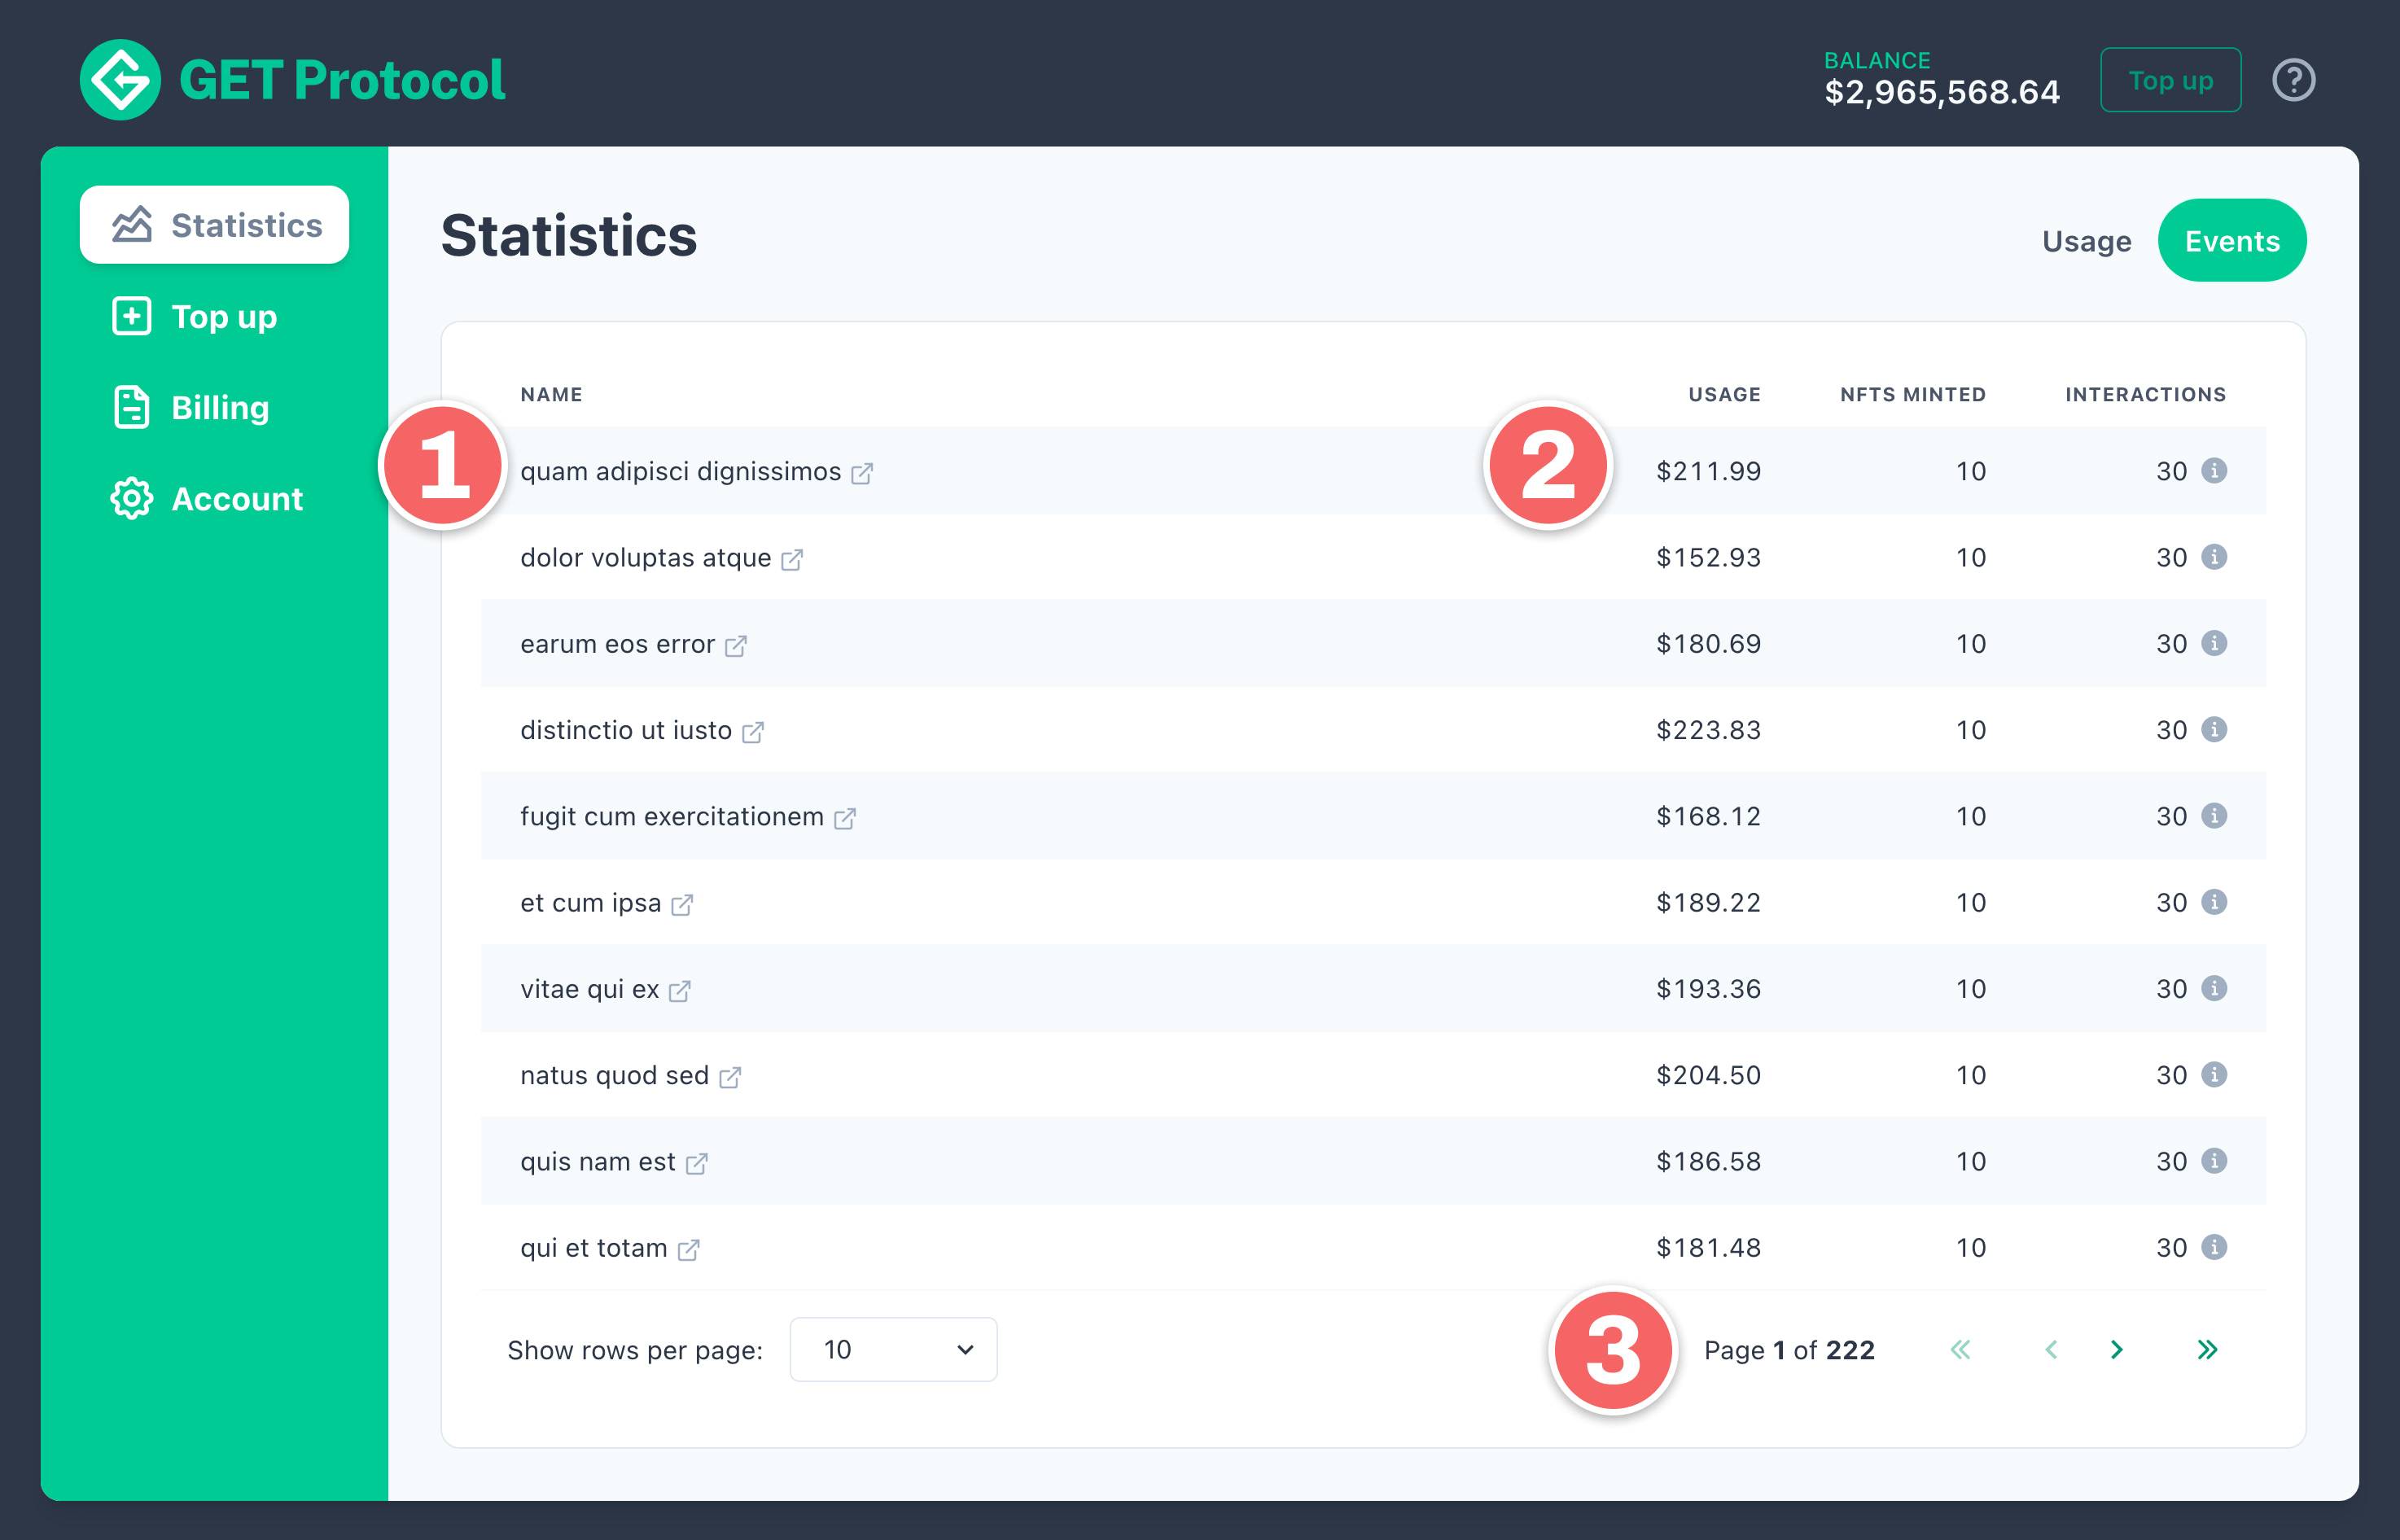
All events you create will be visible on the Events tab.
1. Events List
See a list of events that you have created on the protocol along with its smart contract address. Since each event is its own smart contract this address can be used to search for NFTs on marketplaces and to reference when setting up third party tooling connected to that smart contract.
2. Usage Data
The amount of OPN used as fuel will be listed along with the number of NFTs minted (sold tickets) under that event.
3. Pagination
Use the buttons at the bottom of the table to navigate through the events list to see older events.
Updated about 1 year ago